Built, delivered, documented.
Websites designed and shipped. Data sets interrogated and reported. Each entry names the work, the client context, and what it produced.


— Personal Projects
Design, build, and deploy
KCE & ThriveWorks Website
ThriveWorks Ghana Platform
KCE SaaS Portal
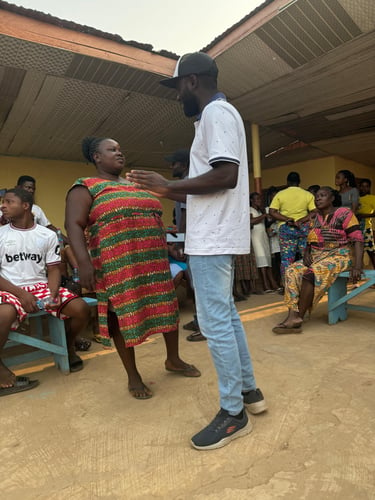
Social Enterprise Development
I built and manage the websites for both KCE Dynamics and ThriveWorks Ghana, handling their full design, development, and ongoing updates.
A SaaS program‑management platform for nonprofits, built to manage beneficiaries, donors, programs, and structured reporting.
A full‑stack commercial operations platform powering accounting, payroll, projects, and workforce management for KCE Dynamics.
From community needs assessment to program development, fundraising, program execution, monitoring and evaluation.
Structural thinking applied to data
Optimization
Value Engineering
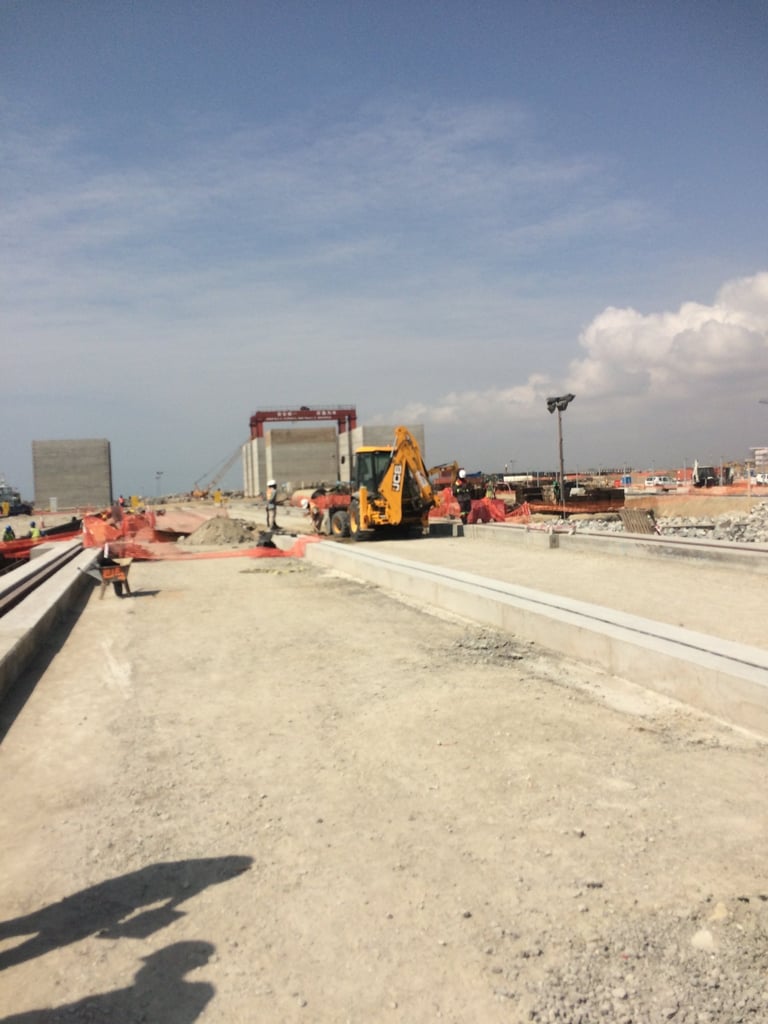
Construction Cost Variance Report
Delivery Route Optimization
Delivering cost‑efficient design alternatives that maintain performance and maximize project value.
Tracking and reporting cost variances to improve forecasting accuracy and support informed decision‑making.
Using data‑driven route analysis to minimize delays and enhance overall operational performance.


Market Intelligence & Deal Sourcing
Integrating financial modeling, market insights, and opportunity sourcing to evaluate project viability, identify high‑value opportunities, and support data‑driven investment decisions.

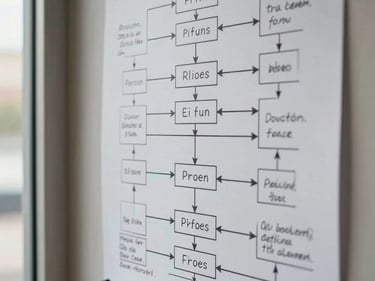
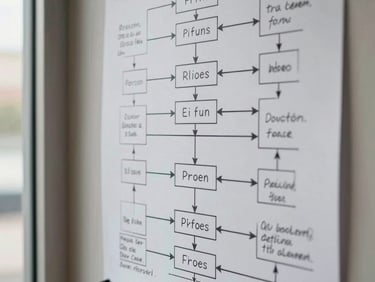
From site data to decision record
The road condition survey moved through three stages: raw field measurement, structured classification, and a final report the client used to allocate maintenance budget.
No model was built without first understanding what the output would be used for. That discipline—working backwards from a decision—applies equally to a website information architecture.
Have a project that needs analysis or a build?
Scope it out directly. The brief, the constraints, and the expected output are the right starting point.